Google Sheets Integration
Snapchat Ads to Google Sheets
By SyncWith
Snapchat Ads Google Sheets integration
Snapchat calls it a video view after 2 seconds of watching, or any swipe up, so Video Views on its own doesn't tell a client much. Show them how many views went to the end. SyncWith puts spend, impressions, swipes, screen time and video views at 25, 50, 75 and 100% in Google Sheets by account, campaign and day, on a schedule.
Install the Addon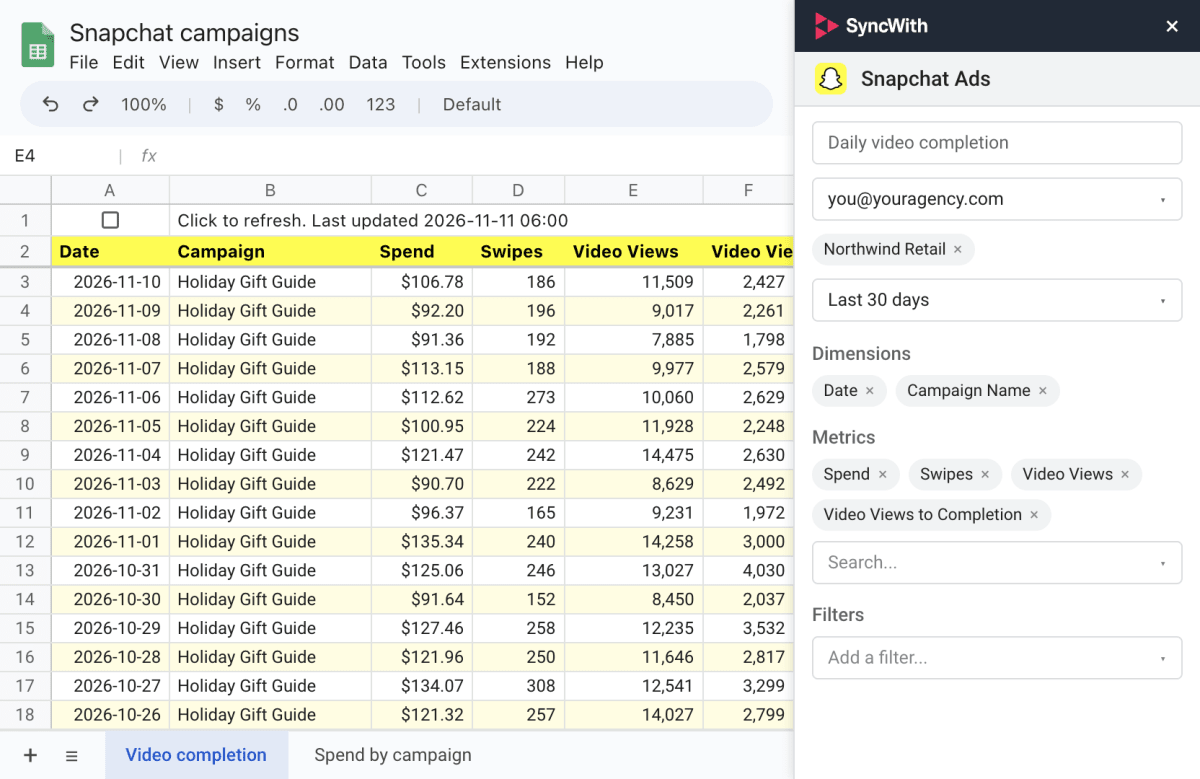
Easily build custom Snapchat Ads reports in Google Sheets
The Snapchat Ads integration gives you the power to slice and dice your Snapchat Ads data to get the insights you need for your business.
Every client’s ad account in one report
Pick any number of Snapchat ad accounts, from any number of logins.
Runs on your schedule
Every 5 minutes, hourly, daily, weekly or monthly. The sheet fills itself in while you get on with your day.
Video drop-off by campaign
Quartile views and screen time for each campaign and day, so you can see where people stopped watching.
Late changes picked up
A day's Snapchat numbers can still change after it ends. Update or add rows re-pulls recent days and rewrites the rows already in your sheet.
What does Snapchat count as a video view?
Video Views counts every impression that was watched for at least 2 seconds in a row, or swiped up on. It counts impressions, not people.
Two seconds isn't much of a watch. The quartile columns show how far each view got: 25%, 50%, 75% and all the way to the end.
Is a swipe the same as a click?
Close enough for a client report. Snap counts a swipe up when someone swipes up on the ad or taps its call to action to open what's attached. In the report, that column is Swipes.
Snap's own cost number, eCPSU, is spend divided by swipe ups: read it as cost per click. Swipe rate, Swipes divided by Impressions, does the job of click-through rate. Pull your clients' Google Ads and Facebook Ads into the same sheet, on the same schedule, and Snapchat sits right next to them.
Which Snapchat numbers go in a client report?
These are the three we'd put in front of a client. Build them in the sheet, next to the columns the report pulls in.
| Our number | Formula | What it tells a client |
|---|---|---|
| Swipe rate | Swipes ÷ Impressions | How often the ad got a swipe up each time it showed. |
| Watched to the end | Video Views to Completion ÷ Video Views | Of the views Snap counted, the share that went all the way. |
| Seconds watched per impression | Screen Time (ms) ÷ 1000 ÷ Impressions | How long the ad held the screen, on average, each time it showed. |
Screen Time comes in milliseconds. Forget the ÷ 1000 and a 3-second average shows up in your client's report as 3,000.
How do I connect Snapchat Ads to Google Sheets?
- Install SyncWith from the Google Workspace Marketplace (in Sheets: Extensions > Add-ons > Get add-ons), then open it from the Extensions menu.
- Pick Snapchat Ads from Connect another account and sign in to Snapchat.
- Pick the ad accounts, as many as you like.
- Add Date, Account and Campaign, then Spend, Impressions, Swipes, Video Views, Video Views to 25%, 50%, 75% and Completion, and Screen Time (ms).
- Pick a start date and run the report once.
- Set it to Update or add rows as needed, and change the date range to the last 3 days.
- Schedule it daily.
Snap finalizes each day's numbers 48 hours after the day ends in the ad account's time zone, so a daily run over the last 3 days picks up the late changes.
Snapchat's own Google Sheets link is for lead forms only: you turn it on with Connect Form to CRM on a lead generation ad. For campaign numbers, Ads Manager gives you a CSV download, or a scheduled report by email that only goes to Snap users with Ads Manager access. Either way, the numbers reach your sheet when someone pastes them in.
Is there a free plan?
Yes. The free Hobby plan gives you 35 refreshes a month with no credit card, and each Hobby report stops after 35 refreshes. A refresh is one run of one report, however many ad accounts it covers. So a daily report with every client's Snapchat account in it uses about 30 a month.
The Business plan is $24.99 a month for 100 refreshes, and paid reports never expire. See all plans.
For a client who'd rather read a dashboard, we also have a Snapchat Ads connector for Looker Studio, on a separate plan: a 14-day free trial, then $24.99 a month.