Hierarchical Reporting
Explore data across levels: track status, location, balance, spend cap and more.
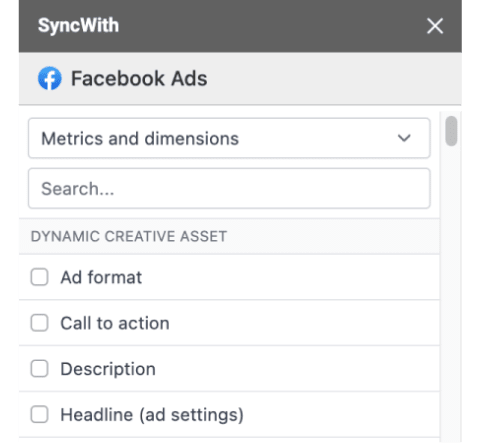
Dynamic Creative Analysis
Report on dynamic creative performance: ad format, CTA, image, text, video, URL, and more.
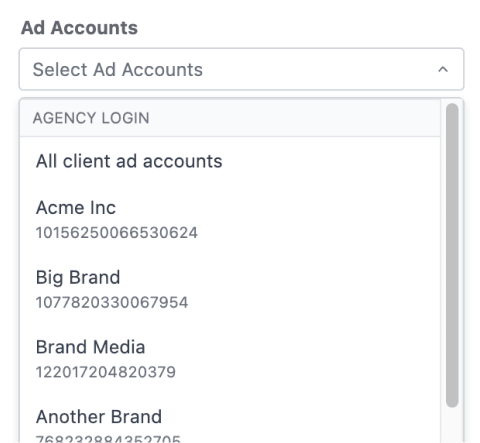
Account Management
Manage single or multiple accounts: account id, name, spend, budget and more.
Ad & Adset Details
Break down data by setup parameters: bid strategy, amount, attribution, start/end times, and more.
Performance Metrics
Analyze results, cost per results, CTR, CPC, clicks, frequency, and reach.
Creative
Pull creative variables into Sheets, including URLs, images, copy, and more.
Delivery Breakdown
Analyze performance by age, country, platform, and more.
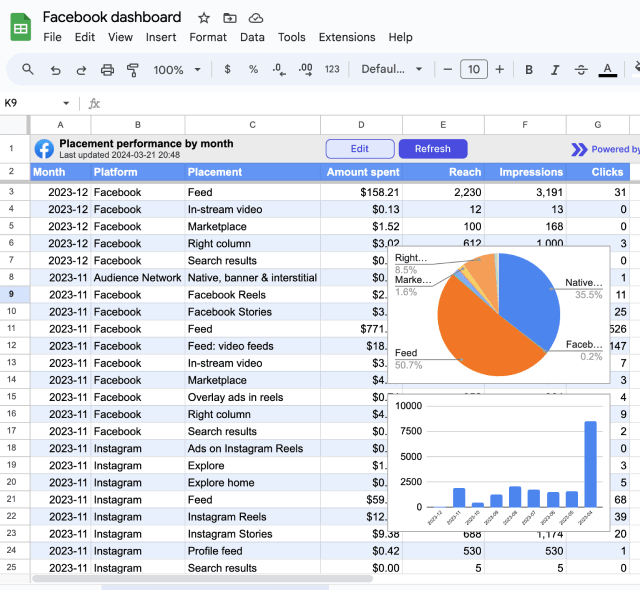
 Facebook Ads to Google Sheets


 Facebook Ads
 Google Analytics
 Google Ads
 Shopify
 MySQL
MySQL Postgres
 Google Search Console