SyncWith

Connect Google Analytics to Google Sheets

Connecting to the Google Analytics V3 API to Google Sheets via SyncWith

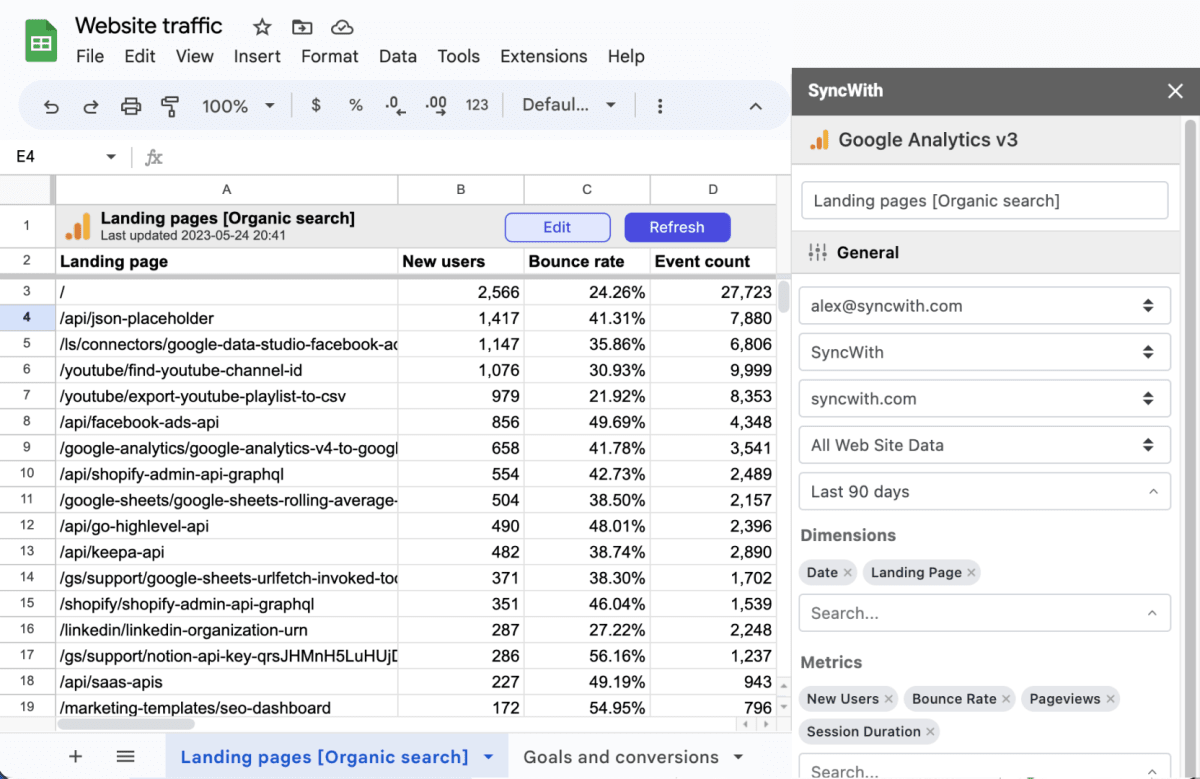
In this reference we’ll look at how to setup a Google Analytics v3 (Universal Analytics) API connection.
We’ll use SyncWith to get your GA Data into Google Sheets. Please see our Google Analytics Guide to see a full listing of all our GA connections, templates, tutorial and specific use cases.
In SyncWith if you search for google analytics you’ll get a few results, including our GA v4 connector and various Google Analytics templates.
The new version of Google Analytics is fast becoming the standard, if you’re already using it please see our article on connecting GA4 to Google Sheets instead.
notion image

Don’t Have SyncWith?

  • SyncWith is a Google Sheets Add On
  • SyncWith allows you to move data from any API into Google Sheets
  • Learn more about why Marketers love SyncWith
  • Check out our Google Workspace Listing and see why we’re the highest rated API add on with over 100,000 installs. Install today and get your data into Sheets in minutes.

Choose a Reporting Time Frame

You can choose from a wide range of default reporting time frames as well as dynamic ones. Some marketers and agencies might report on the last 21 weeks of data. You may or may not want to see the current day in the reporting period.
All are possible with the date range picker. Popular options include:
  • Last 30 days
  • Last 90 days
  • Last Month
  • Month to Date
  • Last 5 Months
notion image

Choosing Your Dimensions

There are a LOT of dimensions available for the Google Analytics so we’ll take a look at some of the more popular ones.
One way to think about dimensions is every time you add one you create more rows.
For example if you have 30 days and 20 countries. If you request date you’ll get 30 rows, if you request country you’ll get 20 rows if you request country and date you’ll get 600 rows (as long as their is data for every day for every country).
For this reason adding just a few dimensions can really explode the number of rows returned.
notion image
Popular Google GA v3 Dimensions
Name
Description
Date
Useful for tracking trends over time
Campaign
Useful for tracking your various marketing paid and un paid marketing campaigns, set via the utm_campaign variable
Source
This refers to the specific site within a given channel, for example if you have medium=social two source of social traffic might be TikTok or Instagram, set via the utm_source
Medium
This refers to the type of channel, eg social, search, direct, email, etc. For example you might have medium=search for traffic from bing, google and duckduckgo
Full Referrer
This shows the domain of the referring site, example values could include: youtube facebook.com/ reddit.com/ google yahoo
Country
Name of the country the user is from, example values could include: United States India Canada Brazil United Kingdom Japan France Germany
Landing Page
This breaks things out by the first page the user started their session on, this is very useful in terms of understanding the pages that are attracting users to your site for instance / - the root of your website /support - your support page /pricing - your pricing page
Page
Unlike landing page this is looking at all pages, so if you had Landing Page and Page as dimensions you’d see all the pages but they would be broken out by Landing Page, this lets you ask the question when someone lands on /pricing where do else do they go on my site
Page Title
Page is Simply the title of the pages. While Page shows the path, Page Title shows the title you’ve specified for example /pricing - Acme Services Pricing Plans
ISO Week of the Year
While the date can be useful getting back stats on a weekly basis can often be more helpful if you want to chart them out, especially if you want to limit the number of rows being returned. Using the ISO week also helps normalize the data in case you want to compare date ranges to other platforms.
Campaign
You can use campaign or utm_campaign to track specific promotions such as: - instagram bio link - specific facebook ad campaigns

Choosing Your Metrics

Metrics can be thought of as the data for every row. Using our example above if you have country and date as dimensions you still need to specify what you want to know about them, for example show me my pageviews and sessions by date by country.
Google Analytics provides a LOT of dimensions some of the more popular ones with descriptions are provided below.
notion image
Popular Page Insight Metrics
Metric
Description
Sessions
Sessions measure the number of visits to your website
Pageviews
Pageview measure the total number times a page was viewed, including multiple views within the same session.
Bounces
Bounces measure when a user left the site on the page they landed on (eg they didn’t view any other pages). For a site that delivers all the value a user needs in the first pageview this won’t indicate anything negative. If a user is expected to view multiple pages eg, view multiple product, go to a checkout cart and then complete payment a a bounce isn’t great.
Bounce Rate
This is the number of bounces divided by sessions. As long as you’re not aggregating and summarizing data in your google sheet you can use bounce rate. But if you’re aggregating data via pivot tables you’ll need to compute your own bounce rate on the aggregates.
Average Session Duration
The average length of a users session
Sessions Duration
Sessions Duration is the total measurable time users spent on their entire sessions, this is useful if you’re using a pivot table and doing rollups and you need to calculate your own average time per session.
Goal x Starts
This will show the number of times a given goal fired as having started.
Goal x Completions
You can setup many goals in Google Analytics which will have the names Goal 1, Goal 2.... Goal n. This will show the number of times a given goal fired as completed.
Unique Pageviews
The unique (meaning only one pageview per person may count) number of times the page was viewed
Pages / Session
The average number of pages the user group views in a session.
Time on Page
Time on page is the total measurable time users spent on the page, this is useful if you’re using a pivot table and doing rollups and you need to calculate your own average time on page.

Limits on Metrics Requested

It should also be noted that if you choose more than 10 metircs Google will through a 400 error:
notion image
 

Sorting By Specific Metrics or Dimensions

You can choose multiple metrics and dimensions to sort by for example:
  • Sort first by Date Ascending
  • Sort second by Sessions Descending
 
notion image

Setting a Row Limit

If you want to limit to say the first 20,000 rows you can set a row limit

Setting the Update Mode

SyncWith supports 3 update modes:
  1. Replace contents of sheet
  1. Append rows to end of sheet
  1. Update or add rows as needed
The first two options are simple in nature, the last option to update or add rows as needed is more advanced.
notion image

Replace Contents of Sheet

PREFERRED MODE
Every time you refresh or SyncWith refreshes based on your predefined schedule, all the cells will be deleted and the new data will be inserted.
  • Any computational rows that you’ve added will not get deleted as long as they are outside of the range being updated. If you’ve inserted a computational row in between other data rows it will get over written
  • Formatting you apply will stay in tact, eg if you specify a percentage, number, date that formatting for the column will persist
  • This mode is ideal for when you don’t want to collect or store previous data. For example you just want the last 30 days of data.

Append Rows to End of Sheet

NOT COMMONLY USED OR RECOMMENDED
Every time you refresh or SyncWith refreshes based on your predefined schedule SyncWith will append the new rows to the last line with data
  • The entire sheet will not be re-sorted based on any sort you have but the appended data will be sorted and appended according to the sort you specified.
  • It will NOT prevent duplicate rows from being created
  • It will NOT update existing rows
  • If you want to only append new rows or properly update existing rows then you need to use Update or Add Rows as Needed
  • This is not a popular updating mode

Update or Add Rows as Needed

USED for use cases where you need to collect historical data
  • This mode uses the date as a key to determine if a row is unique.
  • If the row is unique (we don’t have data from that date yet) then it will add a new row
  • If the row is not unique it will update the metrics if they’ve changed, eg you pulled a partial day the data was updated the most recent pull will update the metrics for the days where the data changed.
This update mode is a great option if you want to collect historical page data, by doing many successful 90 day period pulls of your data across older date ranges you can collect all your historical data, then change the connector to just get the last 7 days data on a daily basis.

Scheduling Your Google Analytics Data to Google Sheets

Manual Refresh

Manual Refresh Is the default scheduling for a connection. Data will not be updated until you actively refresh it. In order to refresh the data you must either:
  • Refresh your data from in the SyncWith addon side bar via the refresh button - all connections can be manually refreshed
notion image
  • Refresh via the Add-on menu, allowing you to refresh all connections setup, or all connection(s) pushing data to the current active sheet
notion image
  • Refresh via the check box (located in the header above the data table)
notion image

Scheduled Refreshes

There are 3 options for scheduled refreshes:
  • Automatically refresh daily will refresh the data every day at the same time. The time is set based on when the connection was last updated. If you wish to set the refresh to happen at a specific time you would need to open the connection and save it at that time.
  • Automatically refresh hourly will refresh the data every hourly
  • Automatically refresh every 5 minutes will refresh the data every 5 minutes. This is not typically used for google analytics - unless you’re looking in detail at the current day. A maximum of 100 connections can use 5 minute refresh.

Sample Connections

Saving Historic Google Analytics Data Before Sunset

You’ve probably heard of the Google Analytics sunset dates that are upcoming. Google announced that in July 2023 Universal Analytics (GA v3) will be sunsetted. This article will deal with the very simple proposition of getting your data out of GA and into Google sheets for historic purposes.
The best approach to storing your historic data is going to be based on the information you’ll care about historically, you are more likely to go look back at broader trends than narrower ones.
We can just select 10 dimensions and 10 metrics and ask for 10 years of data because we’ll run into Google Sheets cell limitation (most recently updated to 10 million cells).
As an example lets say we just want medium, date and 10 metrics for the last 10 years:
  • 365 days * 10 years = 3650 days
  • Lets say 200 different sources
  • 10 Metrics
3650 x 200 x 10 = 7.3M cells of data which is bumping up to the 10M limit (and also making a spreadsheet that will be rather slow.

Strategies for Reducing Rows

Reduce Granularity of Date
Do you really need to see daily data over 10 years? Why not use weekly granularity. Select ISO Week of ISO Year and you’ll get the week and the year in a single cell those 7.3M cells become ~ 1M cells a 7X reduction.
We can go even further and use Month of Year - which has the month and year combined - to get an even bigger reduction - are monthly trends sufficient for your historic analysis
Reduce Granularity of a Set
There are a lot of countries in this world, how many are important to you when looking back? You might have some traffic from 200 countries and you can always download traffic by year for all countries, but you might only want traffic by week for the top 25 countries
Change Granularity for Different Time Frames
  • Maybe the last year you want daily data
  • Maybe the last 5 years you want weekly data
  • Maybe the last 20 years you want monthly data
Don’t limit yourself to a single data set.

Analysis First Approach

  • Start first with the things you know you look at
  • What data goes into your weekly, monthly, annual planning
  • What data do you go back and look at to understand trends
  • What is important to your business
    • Goals you track
    • Traffic sources
    • Referral partners and their specific UTMs

Example 1: Traffic Source and Landing Page

  • This will help you look at long term trends for traffic source and the pages that attracted that traffic
  • We’ve chosen All time so we are gathering as much data as possible
  • Here are the dimensions we’re including:
    • Month of Year - This will return YYYYMM which means we’re only using up a single cell to capture the date and we’re only using 12 rows to capture an entire year of data
    • Landing Page - This will return the page the user landed on which is great for understanding the content that drove visits
    • Source - Source will let us and go back and ask the questions - how has our traffic from reddit trended over time, what were our top pages in year x for reddit, etc
    • Medium - Will help us look at big trends on the types of sources eg email search direct
  • Here are the metrics we’re including
    • Sessions - to understand how many people went to our website from a given source or to a given landing page
    • Bounce Rate & Bounces - We’re including both, if you need to include just one use Bounces as you can calculate bounce rate from Bounces / Sessions. If you’re doing aggregates - eg what was my bounce rate from reddit by year you have to use Bounces as you can’t sum / average bounce rate.
    • Avg. Session Duration & Session Duration - Similarly to bounce rate and bounces we’re including both session duration and avg. session duration. If you want to know the average session duration from google search by year you’ll need to calculate it. Avg. Session Duration = Session Duration / Sessions
    • Goal Completions 1-3 - We’ve found that most people are good at setting up events and goal completions from those events. These are here so you can see long term trends on your top 3 website goals, eg newsletter signups, case study downloads or pricing inquiries - whatever was important for your site.
 
notion image